
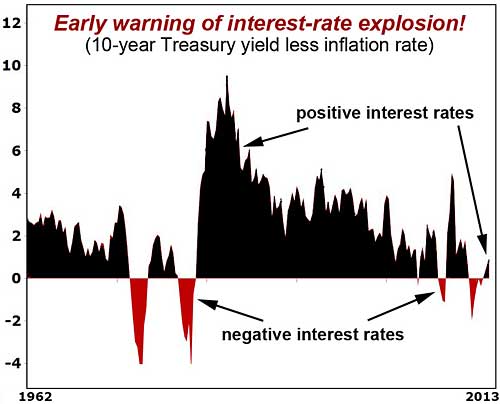
“In the late 1970s, when did we see the critical tipping point that marked the beginning of the surge? It was after three things happened: First, we witnessed two periods of real interest rates below zero (same as recent years) … Second, we experienced an initial collapse in bond markets that began to drive yields higher (same as now) … Third, we saw a cross-over into the black, as interest rates rose above the inflation rate (same as just happened earlier this year). And THAT’s when interest rates went through the roof, carrying the U.S. Treasury-bond yield to 13% and the Treasury-bill rate to 17%.”
http://www.moneyandmarkets.com/the-chart-of-the-century-54071

Did you like this?
Tip Freedomwat.ch Staff with Bitcoin
Tip Freedomwat.ch Staff with Bitcoin
Related posts:
A Cypherpunk's Manifesto (March 9th, 1993)
Ron Paul on the Evolution of Freedom in the 21st Century
Doug Casey Refutes Common Hesitations to Internationalize
Nasser Al-Awlaki: The Drone That Killed My Grandson
Fifteen Benefits of the War on Drugs
The American Hiring Paradigm Is Broken
Bill Bonner: Is This the World’s Cheapest Commodity Play?
The Forever Wars of Frederick & Kimberly Kagan
Civil Forfeiture Of Cash: It Could Happen To You
A Little Bit Of History To Think About
How Snowden's Revelations Have Strengthened the NSA
This failure rate will shock you
In Gold We Trust 2014
Reflections on 9/11 and the High Cost of Waging War in the Middle East
The Security State’s Reaction to Snowden Shows Why It’s Doomed