
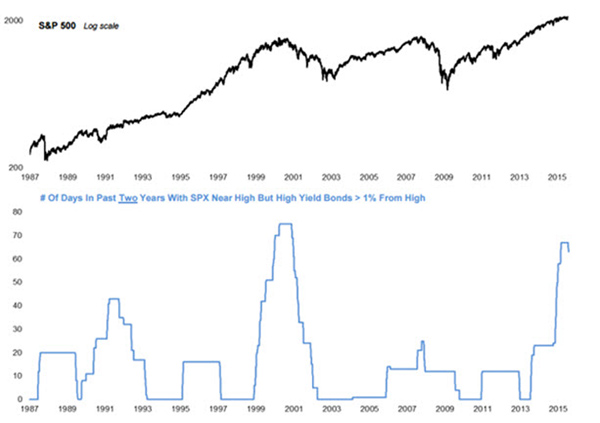
“This pattern of new highs in stocks coupled with new lows in bonds has happened during 48 sessions in the past year. The chart above shows such divergences in blocks since 1987. As you can see, the only time frame that was anywhere near the current abundance of divergences was 1999-2000. Back then, the total first reached the current level of 48 in July 1999. The S&P 500 dropped more than 13% over the next several months, but the bull market didn’t end for more than a year later. Other such spikes in the divergences came just before the crash of 1987 and before a very rocky phase of the market in 1991.”
http://www.moneyandmarkets.com/serious-red-flag-72487

Did you like this?
Tip Freedomwat.ch Staff with Bitcoin
Tip Freedomwat.ch Staff with Bitcoin
Related posts:
Matt Drudge Breaks Up With Republicans, Joins Libertarians
Nigel Farage: We Are Headed To A ‘One World Government’
US DOT Blasts Mississippi For Diverting DUI Funds To Speeding Tickets
Target confirms up to 40 million credit and debit cards are at risk
Jim Rogers: The Worst Crash In Our Lifetime Is Coming
Journal Explores Incentive For False Results In Lab Tests For DUI
Libor Scandal to Reveal Metals Manipulation?
Sheriff’s ‘Provocative And Intimidating’ Tactics Draw Fire After Rubonia Tussle
Green Cab v. City of Bowling Green
Now the CIA Wants Unlimited Access To Your Financial Records
Cities Begin To Ban U.S. Police Training Together With Israeli Military
FBI's Spy In Trump Campaign Also Oversaw 1980 CIA Election Spying Operation
The Cop Shooting So Horrific It Cost Chicago $5 Million to Hide The Video
Defiling the Memory of President Eisenhower
UBS' Friedman: US Might Have to Bail Out Chinese Banks