
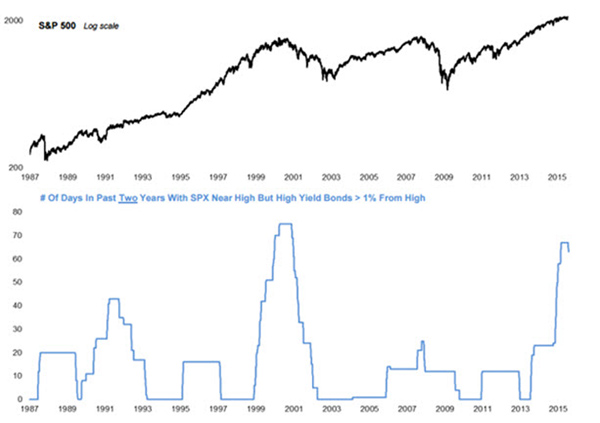
“This pattern of new highs in stocks coupled with new lows in bonds has happened during 48 sessions in the past year. The chart above shows such divergences in blocks since 1987. As you can see, the only time frame that was anywhere near the current abundance of divergences was 1999-2000. Back then, the total first reached the current level of 48 in July 1999. The S&P 500 dropped more than 13% over the next several months, but the bull market didn’t end for more than a year later. Other such spikes in the divergences came just before the crash of 1987 and before a very rocky phase of the market in 1991.”
http://www.moneyandmarkets.com/serious-red-flag-72487

Did you like this?
Tip Freedomwat.ch Staff with Bitcoin
Tip Freedomwat.ch Staff with Bitcoin
Related posts:
Bitcoin a Refuge For Argentines Tired of Government's Currency Despotism
The U.S. Plot to Nuke the Moon
Gerald Celente on Marijuana Legalization and OccupyPeace
Barnes & Noble Slides Toward Bankruptcy
Congress approves surveillance legislation tucked into budget package
Obama would rather look stupid than interfere with the flow of cash to drug-war profiteers
Should Detroit’s Bankruptcy Be an Early-Warning Sign for Washington?
Free Online Education Is Illegal in Minnesota
Blueseed Entrepreneur Cruise Ship Continues Full Steam Ahead with Bitcoin Funding
Working Class Whites Are Giving Up Hope.
What's the Deal with Bitcoins Anyway?
Bitcoin, gold and competitive currencies
New Hampshire Cops Kill Man Fleeing Drug Sting
Government Agencies Across U.S. Leak Their Passwords In Public Trello Boards
ECB Warning: More Directed History