
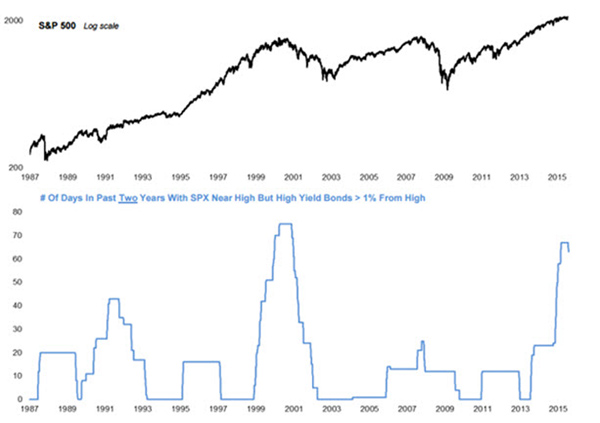
“This pattern of new highs in stocks coupled with new lows in bonds has happened during 48 sessions in the past year. The chart above shows such divergences in blocks since 1987. As you can see, the only time frame that was anywhere near the current abundance of divergences was 1999-2000. Back then, the total first reached the current level of 48 in July 1999. The S&P 500 dropped more than 13% over the next several months, but the bull market didn’t end for more than a year later. Other such spikes in the divergences came just before the crash of 1987 and before a very rocky phase of the market in 1991.”
http://www.moneyandmarkets.com/serious-red-flag-72487

Did you like this?
Tip Freedomwat.ch Staff with Bitcoin
Tip Freedomwat.ch Staff with Bitcoin
Related posts:
7 Teenagers Arrested for End-Of-Year Water Balloon Prank
Border guards force US citizen to unlock his work phone
Use of Marijuana Said to Reduce Deaths From Painkillers by 25%
CA Highway Patrol officer accused of sexual battery against disabled man
Dell apologizes for ‘inconvenience’ caused by NSA backdoor
Reports: Speeding Not A Cause Of Child Accidents
California: Audit Finds Nearly Non-Existent Yellow At Red Light Camera Intersection
Tennessee: Officer Testimony Beats Hard Evidence in Speeding Case
SpyFiles 3: A growing surveillance industry amidst government inaction
UK Telegraph: 'We No Longer Have Free Markets'
The Two Most Important Questions About Gold Today
A Helping Hand for Bernanke and Co.
Alix Announces Initial Bitcoin Mining Exploration Transaction
House Staffer Tells Me What AIPAC Is Doing
Leniency for a Uniformed Sexual Predator