
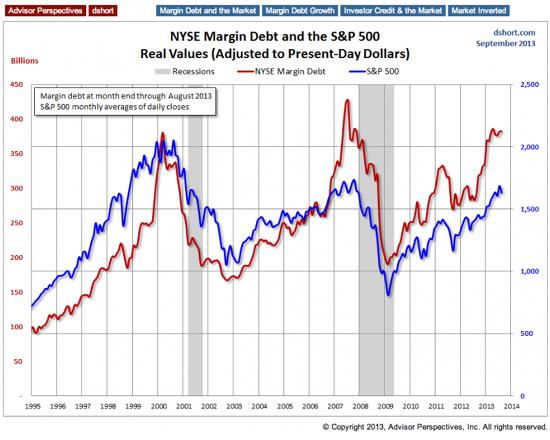
“See the next chart, which tracks the S&P 500 and margin debt, the amount of money investors are borrowing against their shares of stock to buy more stock. The chart seems to show that when investors are optimistic enough to use leverage to invest in already-risky stocks, then the good times have pretty much run their course and something nasty is imminent. If recent history is our guide, it is now time to either take some money off the table or short the hell out of the big indexes – or whatever else you like to do when the market looks overbought. But this conclusion is only valid if we’re in the same stage of the credit bubble as during those two previous sentiment peaks.”

Did you like this?
Tip Freedomwat.ch Staff with Bitcoin
Tip Freedomwat.ch Staff with Bitcoin
Related posts:
Fox commentator was paid $50,000 to tout stock
Paper Claims SEC Regulation is Biased ... In Other News, Sky Is Blue
Spy, or pay up: FBI-backed bill would fine US firms for refusing wiretaps
Breakfast with Pussy Riot
Christopher A Hartwell on Thailand and Bitcoin
Canada's New Digital Divide: The Digital Currency Challenge
Regulation Means The Bitcoin Gold Rush Will Not Happen In The US, Say Experts
Fantasy Dream: Easy Retirement (If You Have $1 Million).
Experimental Private Rocket Makes Highest Test Hop Yet
California lieutenant governor: ‘Do the damn right thing’ and legalize marijuana
Ex-Army sergeants accused of working as drug cartel’s killers-for-hire
JFK: Will We Ever Know the Truth?
US Set to Launch 'Iraq, The Sequel', in Syria
Newly leaked NSA program sees 'nearly everything' you do
Top UK official involved in national porn filter arrested for child porn