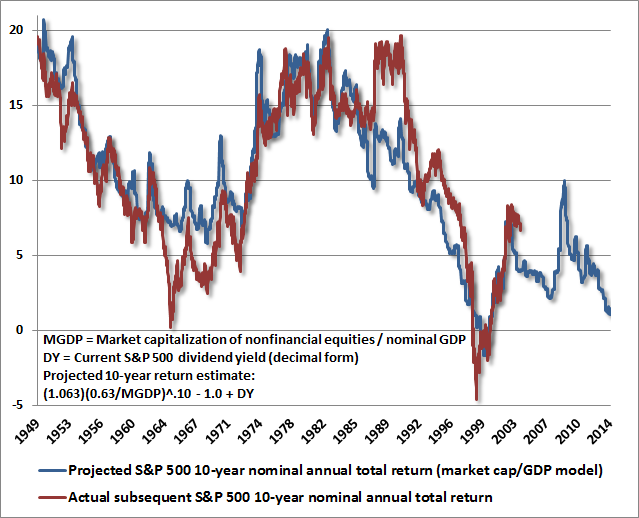
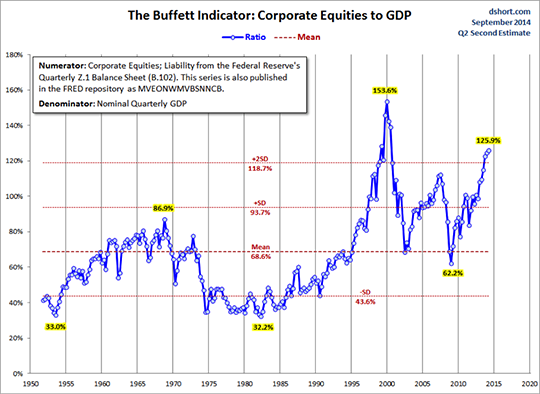
“In 2000, the ratio of market cap to GDP for the Wilshire 5000 (a good proxy for the US stock market) reached 153%. This didn’t stop investors pouring money into US stocks… which went on to deliver a negative total return over the next 10 years. Fast-forward to today, and the ratio of market cap to GDP for the Wilshire 5000 stands at 125%. That’s not as high as at the peak of the dot-com bubble. But it’s higher than at the 2007 peak of the recent credit bubble. And it’s more than two standard deviations above the average – a measure legendary contrarian fund manager Jeremy Grantham uses to pinpoint a bubble.”
http://bonnerandpartners.com/hidden-bear-market-brewing/

Did you like this?
Tip Freedomwat.ch Staff with Bitcoin
Tip Freedomwat.ch Staff with Bitcoin